Calls & Observability
Every voice agent call, with transcript, recording, per-turn latency waterfall, usage, and deployment history.
Every call a voice agent handles — browser, phone, or WebSocket — becomes a row on the Calls tab, with a transcript, metrics, and optionally a recording. This is where you find out what your agent actually says to people.
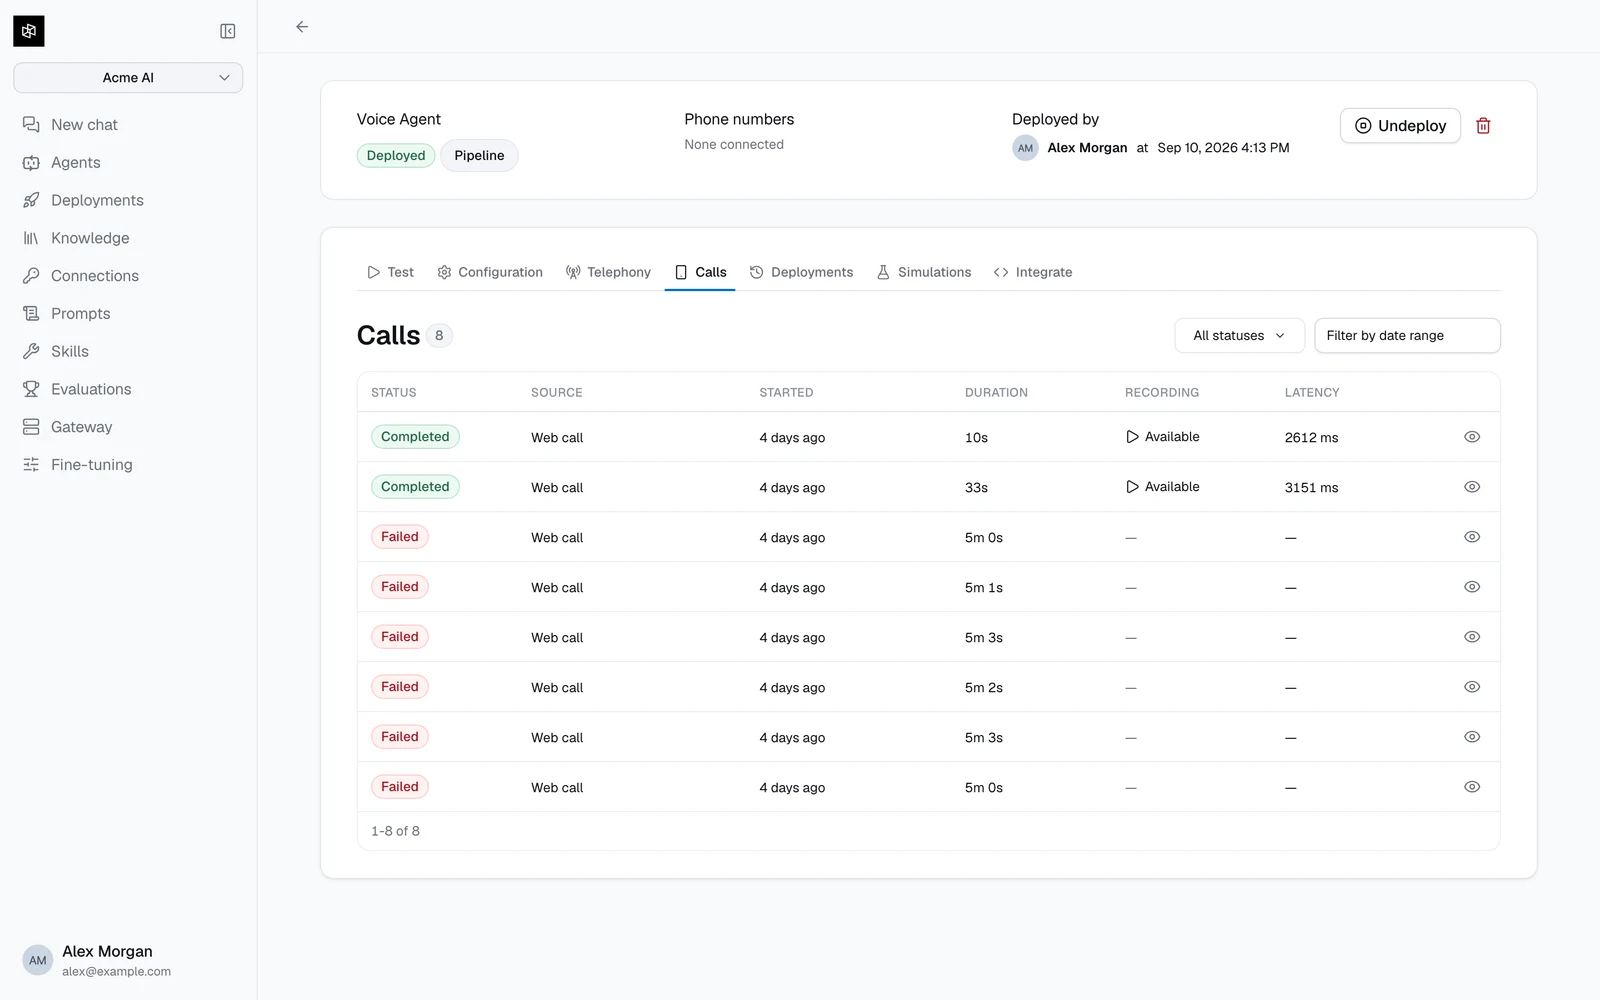
The call list
| Column | What it shows |
|---|---|
| Status | Active (live, updating), Completed, or Failed. |
| Source | Web call, or the caller's number and direction for a phone call. Calls arriving over the WebSocket transport are recorded as web calls, not as a separate kind. |
| Started | When the call began. |
| Duration | How long it lasted. |
| Recording | Available, Processing…, Off, or — — see what each means. |
| Latency | The call's median (p50) response latency. |
Filter by status and by date range. The list refreshes while you watch it, so an active call updates in place.
A single call
Click any row to open the call.
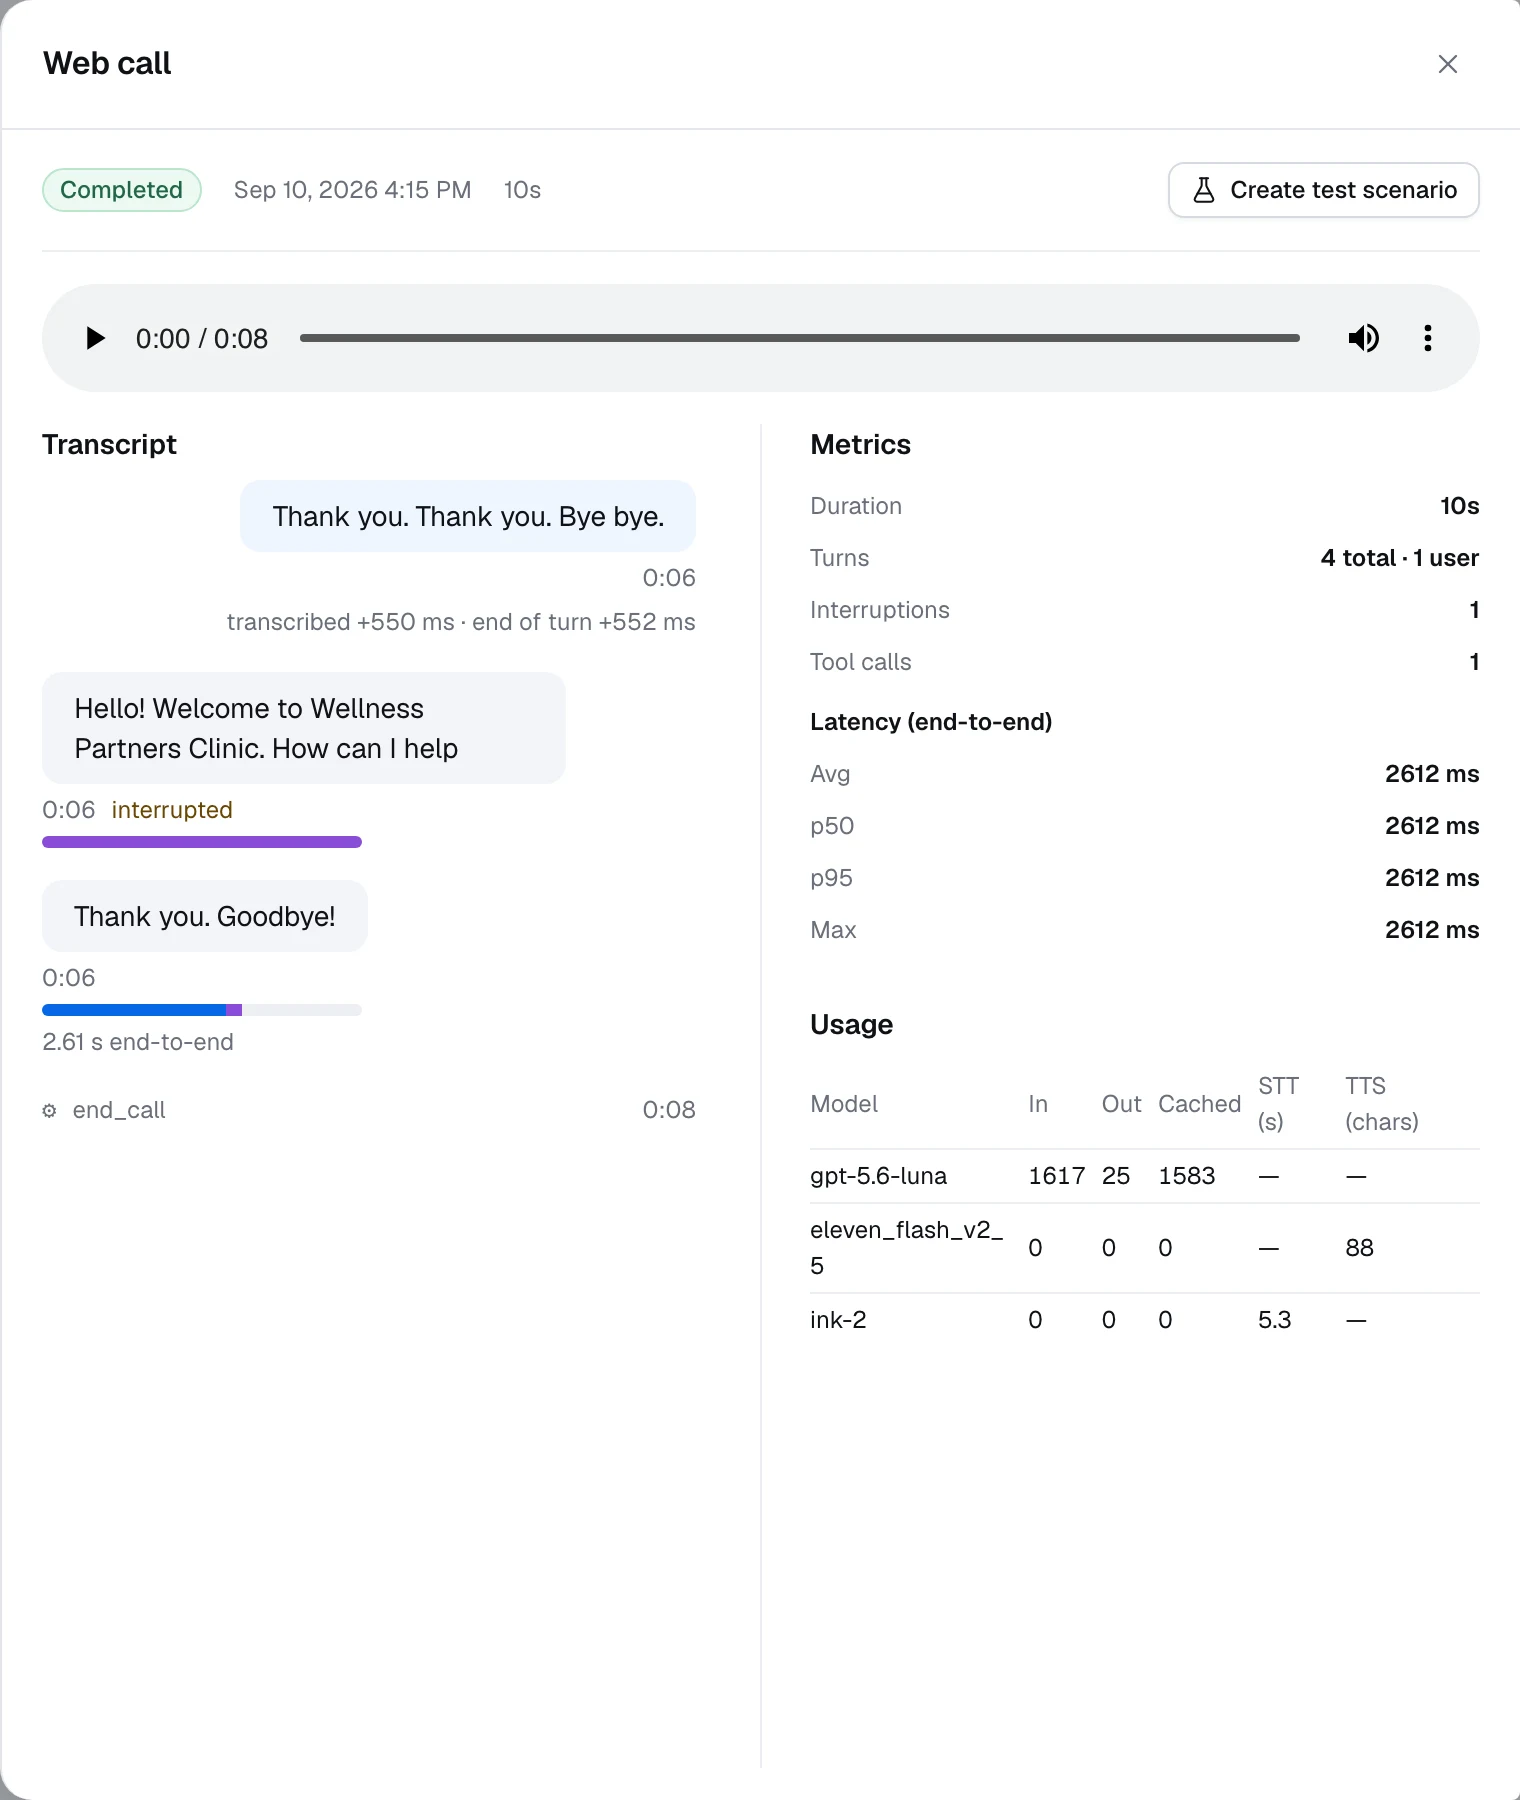
The header carries status, start time, duration, and — for a finished call with a transcript — Create test scenario, which turns this conversation into a simulation scenario. Use it every time a call goes wrong; see Test & simulate.
Transcript
The full conversation, caller on the right, agent on the left, with tool calls shown inline as their own turns. Each turn carries its offset from the start of the call, and turns the caller interrupted are marked as such.
Long calls are summarized rather than stored whole: only the last 500 turns are kept, and each turn's text is truncated at 4000 characters with a marker. For a long call, the transcript is not the complete conversation.
Interruption markers are worth reading closely. An agent that gets cut off on most turns is talking too long, not listening badly.
Recordings
Recording depends on your environment, not just the agent. The per-agent Record calls switch is on by default, but nothing is captured unless recording is also enabled and configured for your Dynamiq environment. Where it isn't, the switch is disabled and says so, and your setting is kept for when it is.
Recording calls has legal obligations that vary by jurisdiction — consent, disclosure, retention — and they are yours to meet.
When a recording is available, it plays inline. Audio is fetched on demand through a link valid for one hour rather than being served from a public URL. Recordings are stored as OGG audio.
What the recording state means:
The Recording column shows one of four things, and — covers two different situations:
| Column shows | Status | Meaning |
|---|---|---|
| Off | disabled | Recording was disabled for this call. |
| Available | available | The file is in storage and can be played. |
| Processing… | pending, call ended | Capture finished but the file hasn't been confirmed in storage yet. This normally settles within minutes; the platform keeps retrying for 24 hours before giving up and marking it failed. |
| — | pending, call still active | Still capturing. There is nothing to process until the call ends. |
| — | failed | Capture or storage failed. Hovering the dash shows "Recording unavailable". |
A call longer than 3 hours has its recording truncated at that point, even though Max call duration allows up to 4.
Metrics
The rail to the right of the transcript:
| Metric | Meaning |
|---|---|
| Duration | Total call length. |
| Turns | Total turns, and how many were the caller's. |
| Interruptions | How often the caller cut the agent off. |
| Tool calls | How many tools ran during the call. |
| Latency | Avg, p50, p95, and max response latency. |
| Usage | Per model: input, output, and cached tokens; speech-to-text seconds; text-to-speech characters. |
The Usage table is the per-call cost record. Since voice agents call providers with your own credentials, this is what reconciles against your provider invoices.
The latency waterfall
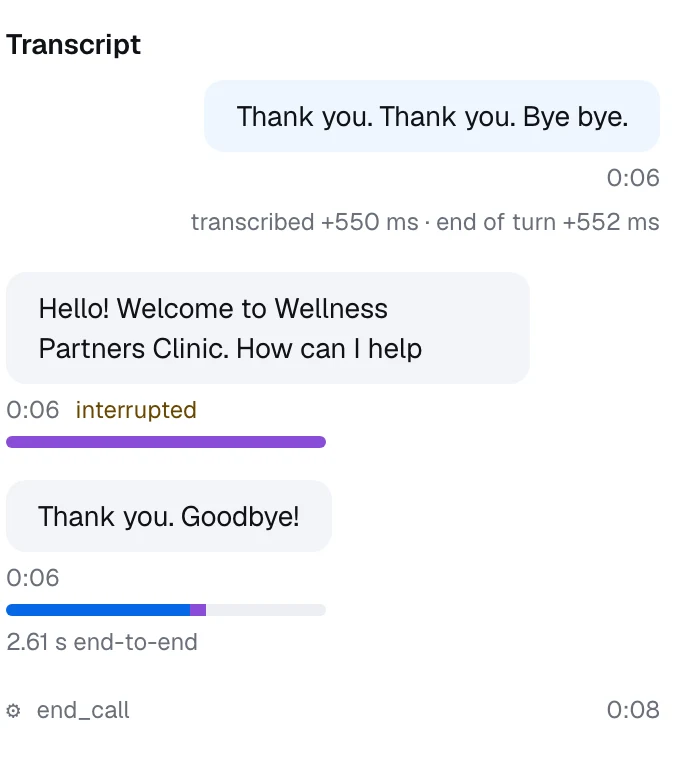
Each turn shows where its time went:
| Stage | Reported on | Meaning |
|---|---|---|
transcription_delay_ms | Caller turns | Time to transcribe what the caller said. |
end_of_turn_delay_ms | Caller turns | Time spent deciding the caller had finished. |
llm_ttft_ms | Agent turns | LLM time to first token. |
tts_ttfb_ms | Agent turns | Text-to-speech time to first byte. |
end_to_end_ms | Agent turns | Caller stopped speaking → caller heard audio. The number that matters. |
Agent turns render as a proportional two-segment bar — LLM, then text-to-speech — so the stage to attack is visible at a glance. A stage that wasn't measured is omitted rather than shown as zero, so a missing segment means "not reported", not "instant".
Read this alongside Turn-taking & latency: a large end_of_turn_delay_ms is a settings problem, a large llm_ttft_ms is a model choice, and a large tts_ttfb_ms means switch to a faster voice model.
Realtime agents report differently. A speech-to-speech model has no pipeline stages, so the rail is labelled Response latency (TTFT) instead of Latency (end-to-end) and there is no per-stage breakdown. The two numbers are not comparable — don't read a realtime TTFT against a pipeline end-to-end and conclude the realtime agent is faster.
Why a call ended
Every call records an end reason:
| Reason | What happened |
|---|---|
user_hangup | The caller hung up. |
agent_hangup | The agent ended the call with its hang-up tool. |
transfer | The agent transferred the caller to a human. |
max_duration | The call hit Max call duration. |
silence_timeout | No caller speech for Silence hang-up seconds. |
interrupted | The call was cut short — either the worker was drained mid-call, or it went away entirely and the platform closed the record for it. |
error | Something failed; the call carries the error. |
The distribution is a health metric in itself. A rising silence_timeout share usually means callers are giving up, and a rising max_duration share means the agent isn't closing conversations.
Two things to know when reading these. The end reason is recorded on the call but is not shown in the UI — you get it from the API. And treat the list as open: a platform update can add a reason without warning.
A call can be marked Failed even though the transcript reads normally. The status reflects whether an error was recorded at any point during the session, not whether the conversation reached a sensible end. Check the call's error before assuming the caller had a bad experience.
Reporting an error
Voice errors are deliberately generic. Whatever went wrong underneath, what you see is a short neutral sentence — "The call ended with an error.", "The hosted worker deployment failed. Check the configuration and retry." — followed by a short id in parentheses:
The hosted worker deployment failed. Check the configuration and retry. (ref: a1b2c3d4)That ref is the thing to quote in a support request. The full underlying error is recorded against it, with the vendor-specific detail stripped out before the message ever reaches the UI or the API. There is no more detail to find in the product — the id is the link to it.
Call errors name the pipeline stage rather than a vendor, so an error reading language model: … tells you which stage to look at, and which model to try changing.
Deployment history
The Deployments tab records every deploy attempt for the agent: Status, Started by, Started, Ended (and by whom), the Version of the worker that was deployed, and any Error.
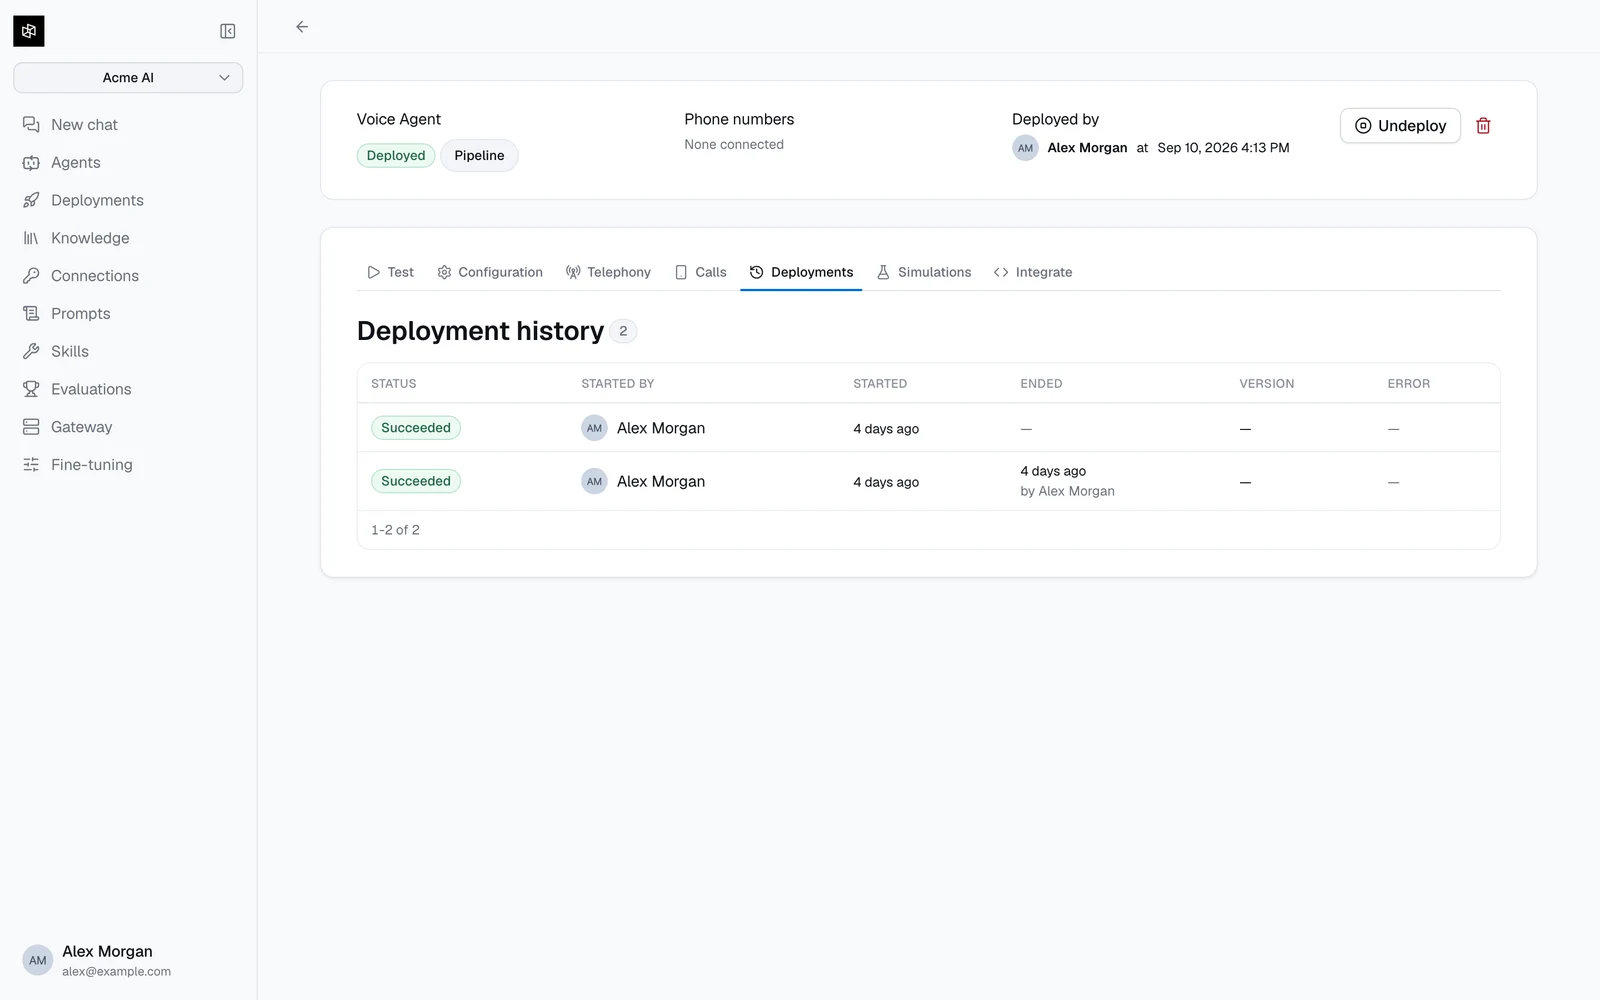
Remember that configuration changes don't appear here, because they don't require a deploy — they apply to new calls immediately. This tab tracks worker deployments only, so it answers "when did the runtime change", not "when did someone edit the prompt".