Gateway Tracing
Ingest traces from open-source Dynamiq workflows into your project and inspect them in the AI Gateway's Tracing tab.
Workflows built with the open-source Dynamiq Python SDK run anywhere — your laptop, your own Kubernetes, a Lambda. Gateway tracing lets those runs report into the platform: attach DynamiqTracingCallbackHandler to a run and the SDK posts the full execution tree to the trace collector at https://collector.getdynamiq.ai, where it appears in your project's AI Gateway → TRACING tab next to everything else.
Traces from deployed Apps are captured automatically — no handler needed. This page is about workflows running outside the platform. For App traces, see Monitoring, History & Traces.
Send traces from your code
Create a project-scoped Access Key
In Settings → Access Keys, create a key scoped to the project that should receive the traces. The collector attributes incoming traces to the key's project, so an org-scoped key (no project) is rejected with 401.
Export it as an environment variable:
export DYNAMIQ_ACCESS_KEY="<your-project-scoped-access-key>"Attach the tracing handler
Add DynamiqTracingCallbackHandler to the run's callbacks. It reads DYNAMIQ_ACCESS_KEY from the environment if you don't pass access_key explicitly, and sends to https://collector.getdynamiq.ai by default (override with base_url for self-hosted installations):
import os

from dynamiq import Workflow
from dynamiq.callbacks import DynamiqTracingCallbackHandler
from dynamiq.connections import OpenAI as OpenAIConnection
from dynamiq.flows import Flow
from dynamiq.nodes.agents import Agent
from dynamiq.nodes.llms import OpenAI
from dynamiq.runnables import RunnableConfig


def main():
    llm = OpenAI(
        connection=OpenAIConnection(api_key=os.getenv("OPENAI_API_KEY")),
        model="o4-mini",
        temperature=0.4,
    )
    agent = Agent(
        name="Simple Agent",
        llm=llm,
        role="You are a helpful assistant.",
    )

    workflow = Workflow(id="simple-workflow", flow=Flow(nodes=[agent]))

    tracing_handler = DynamiqTracingCallbackHandler(
        access_key=os.environ.get("DYNAMIQ_ACCESS_KEY"),
    )

    result = workflow.run(
        input_data={"input": "Hello, how are you?"},
        config=RunnableConfig(callbacks=[tracing_handler]),
    )

    print("Result:", result.output)


if __name__ == "__main__":
    main()
The same snippet, prefilled, lives in the UI under AI Gateway → TRACING → INTEGRATION.
Run it
When the run finishes, the handler POSTs a batch of runs — the Workflow, its Flow, and every node execution — to POST /v1/traces on the collector. Delivery failures are logged by the SDK but never raise into your workflow, so tracing can't break a production run.
View traces in the UI
Open AI Gateway → TRACING in the project your Access Key is scoped to. The TRACES sub-tab lists ingested traces, newest first.
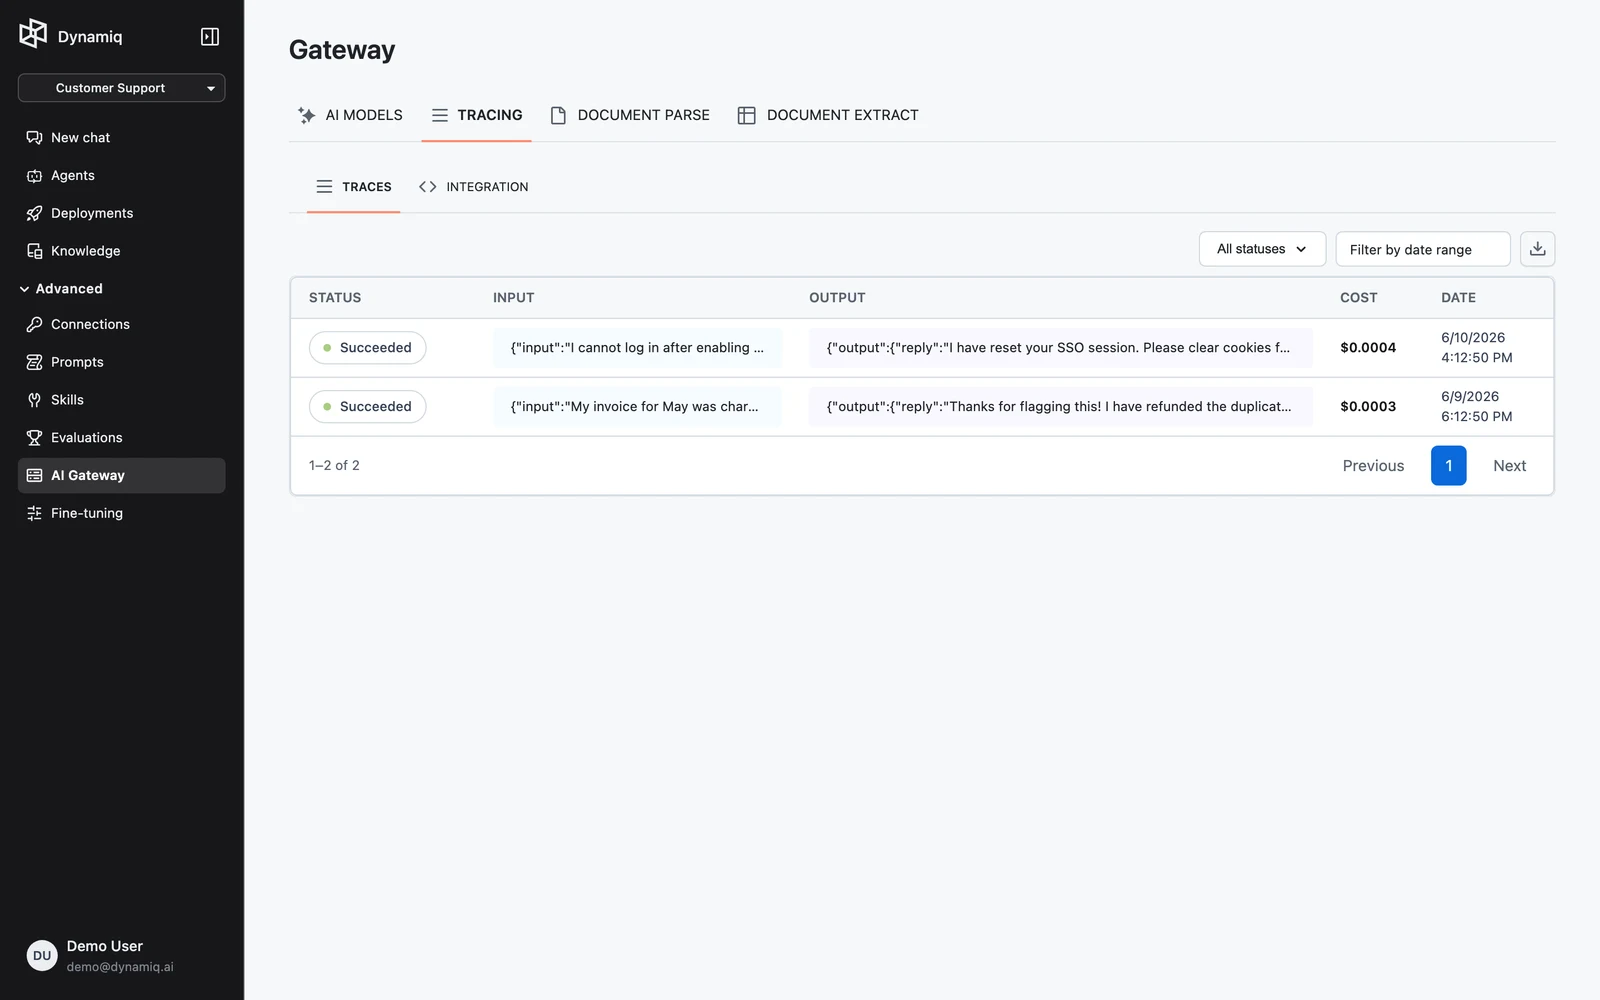
- Filter by status (succeeded, failed, or canceled) and by date range; both reset the list to page one.
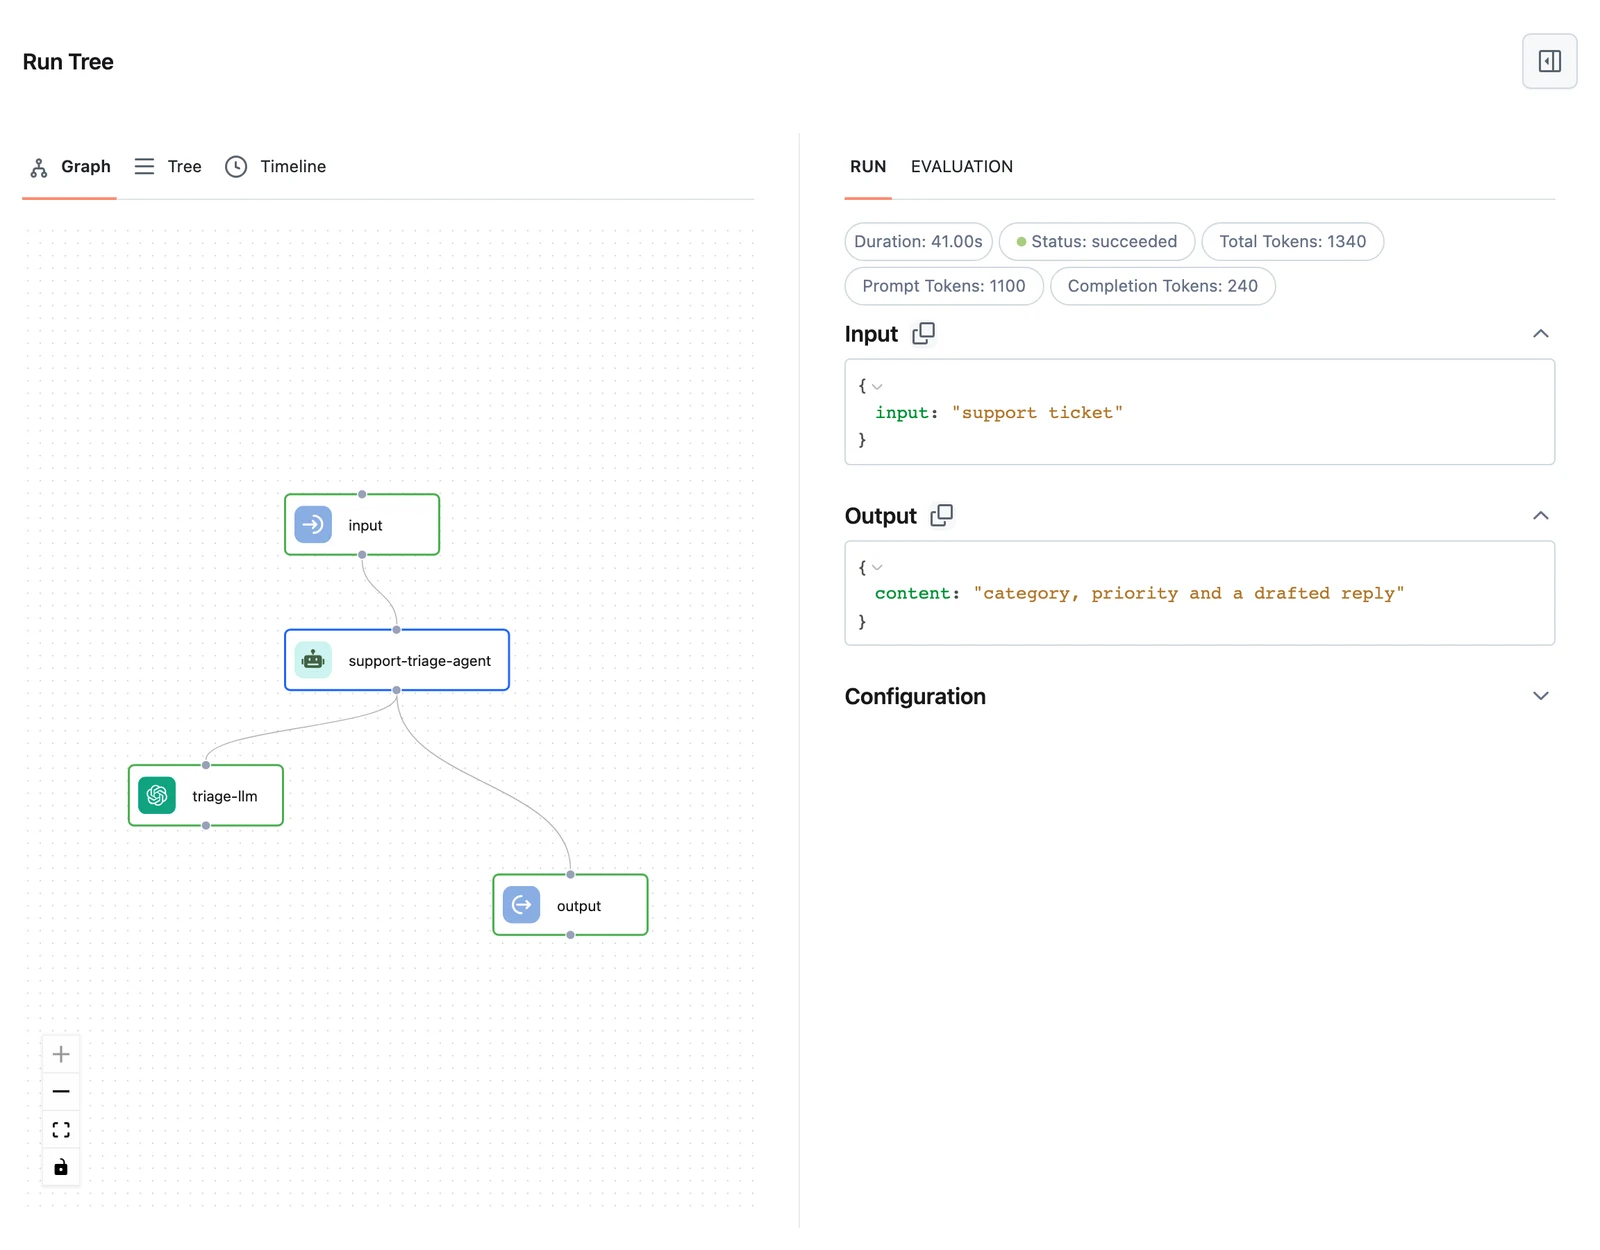
- Click a trace's status label to open the trace side sheet with the full execution tree — every node's input, output, timing, and errors.
- Use the download button to export the listed traces as JSON.
Sending traces without the SDK
The collector accepts any client that can speak its HTTP contract: POST https://collector.getdynamiq.ai/v1/traces with Authorization: Bearer $DYNAMIQ_ACCESS_KEY and a JSON body of {"runs": [...]} — at least one run is required. The run objects are what the SDK's TracingCallbackHandler produces; see the Ingest trace runs reference for the validated fields.
SDK: Tracing to Dynamiq
The SDK-side guide to tracing handlers and run lifecycles.
API reference: Ingest trace runs
The collector's request schema and validation rules.
Monitoring, History & Traces
Traces for deployed Apps — captured automatically.
API Keys & Tokens
Create the project-scoped Access Key the collector requires.