Monitoring, History & Traces
Track invocations, latency, token usage, and cost for a deployed App, and drill into the full execution trace of every run.
Every run of a deployed App is recorded. The Monitoring tab aggregates runs into time-series charts (requests, latency, tokens, cost), and the Traces tab lists each individual run with its input, output, cost, and a full execution tree you can inspect node by node — or download as JSON.
The Monitoring tab
Open your App and switch to the Monitoring tab. The Deployment monitoring view shows four charts for the selected date range (the last 14 days by default):
| Chart | What it shows |
|---|---|
| Cost | LLM spend in USD, split into prompt and completion token cost, with the total for the period |
| Tokens | Prompt and completion tokens consumed, with the total token count |
| Requests | Invocation counts split into successes and failures |
| Latency | Average run duration in seconds per interval |
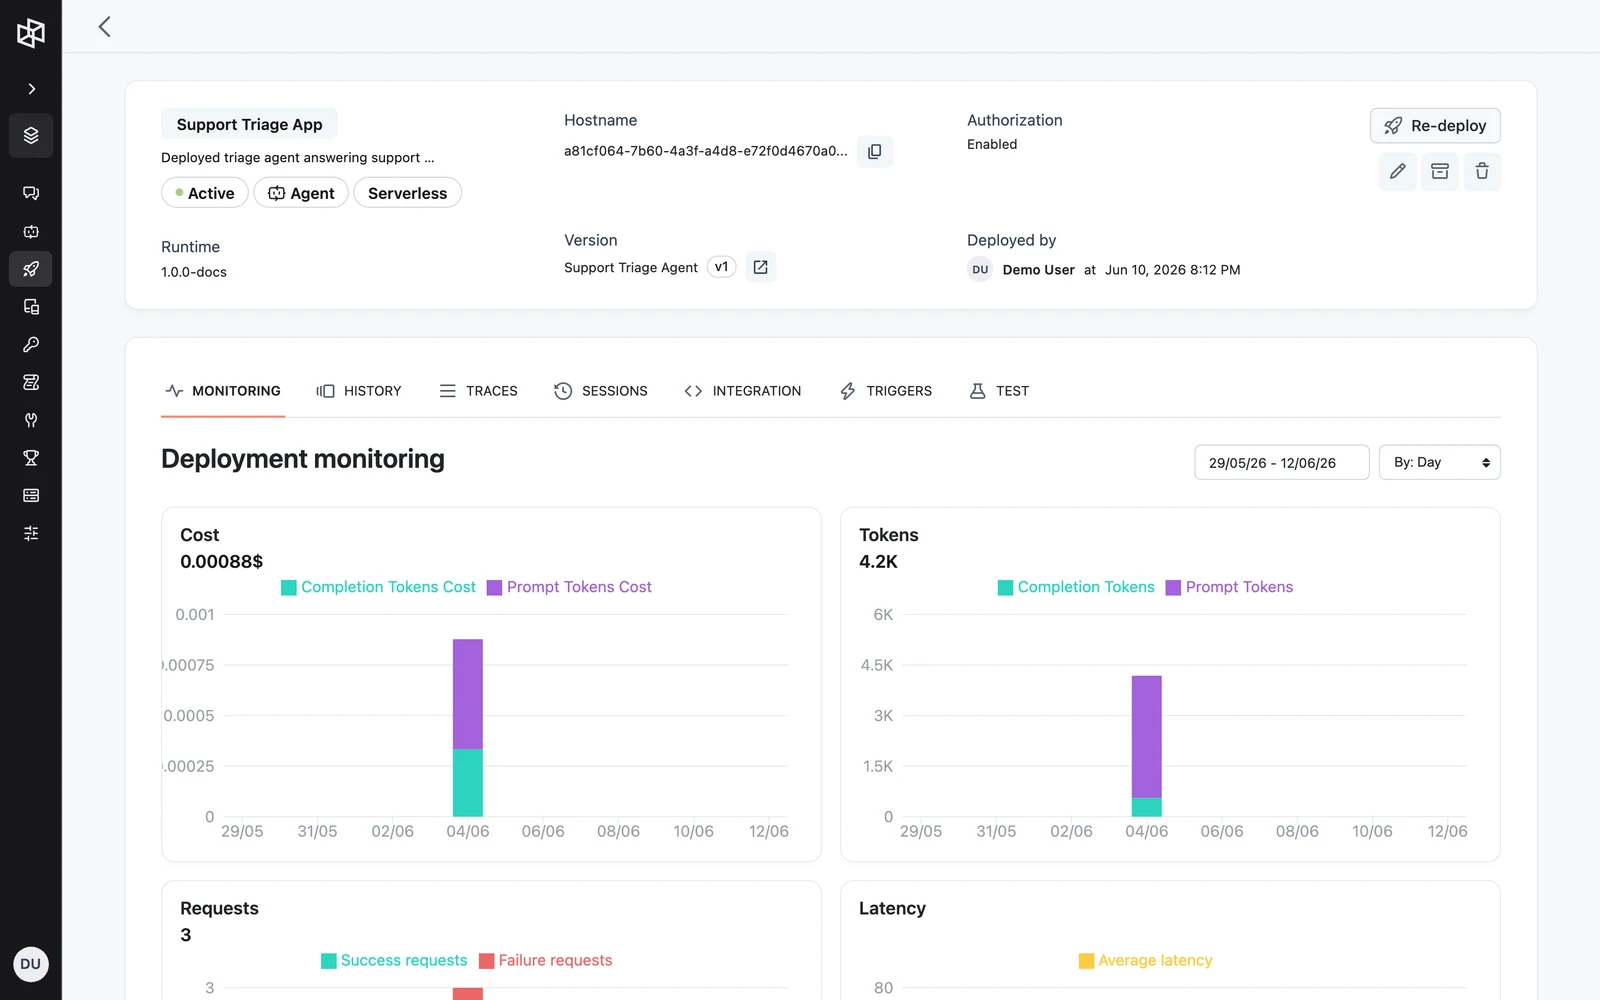
Use the date range picker to change the window, and the By: Hour / Day / Week / Month select to change the aggregation interval.
Query metrics via the API
The charts are backed by a single endpoint:
GET /v1/apps/{app_id}/metricsAll three query parameters are required:
start_timestring (RFC 3339)requiredend_timestring (RFC 3339)requiredintervaldurationrequiredcurl "https://api.getdynamiq.ai/v1/apps/$APP_ID/metrics?start_time=2026-05-27T00:00:00Z&end_time=2026-06-10T23:59:59Z&interval=24h" \
-H "Authorization: Bearer $DYNAMIQ_PAT"import os
import requests
resp = requests.get(
f"https://api.getdynamiq.ai/v1/apps/{os.environ['APP_ID']}/metrics",
headers={"Authorization": f"Bearer {os.environ['DYNAMIQ_PAT']}"},
params={
"start_time": "2026-05-27T00:00:00Z",
"end_time": "2026-06-10T23:59:59Z",
"interval": "24h",
},
)
resp.raise_for_status()
metrics = resp.json()["data"]
print(metrics["summary"])const params = new URLSearchParams({
start_time: '2026-05-27T00:00:00Z',
end_time: '2026-06-10T23:59:59Z',
interval: '24h',
});
const res = await fetch(
`https://api.getdynamiq.ai/v1/apps/${process.env.APP_ID}/metrics?${params}`,
{ headers: { Authorization: `Bearer ${process.env.DYNAMIQ_PAT}` } },
);
const { data } = await res.json();
console.log(data.summary);The response contains a summary for the whole window and a series of per-interval buckets:
{
  "data": {
    "summary": {
      "invocation_count": 412,
      "usage": {
        "total_tokens": 1882340,
        "total_tokens_cost_usd": 12.41
      }
    },
    "series": [
      {
        "timestamp": "2026-06-09T00:00:00Z",
        "metrics": {
          "success_count": 38,
          "failure_count": 2,
          "duration": { "avg": 5230 },
          "usage": {
            "prompt_tokens": 91200,
            "completion_tokens": 14380,
            "prompt_tokens_cost_usd": 0.45,
            "completion_tokens_cost_usd": 0.21
          }
        }
      }
    ]
  }
}
duration.avg is in milliseconds; the Latency chart divides by 1000 to display seconds.
The Traces tab
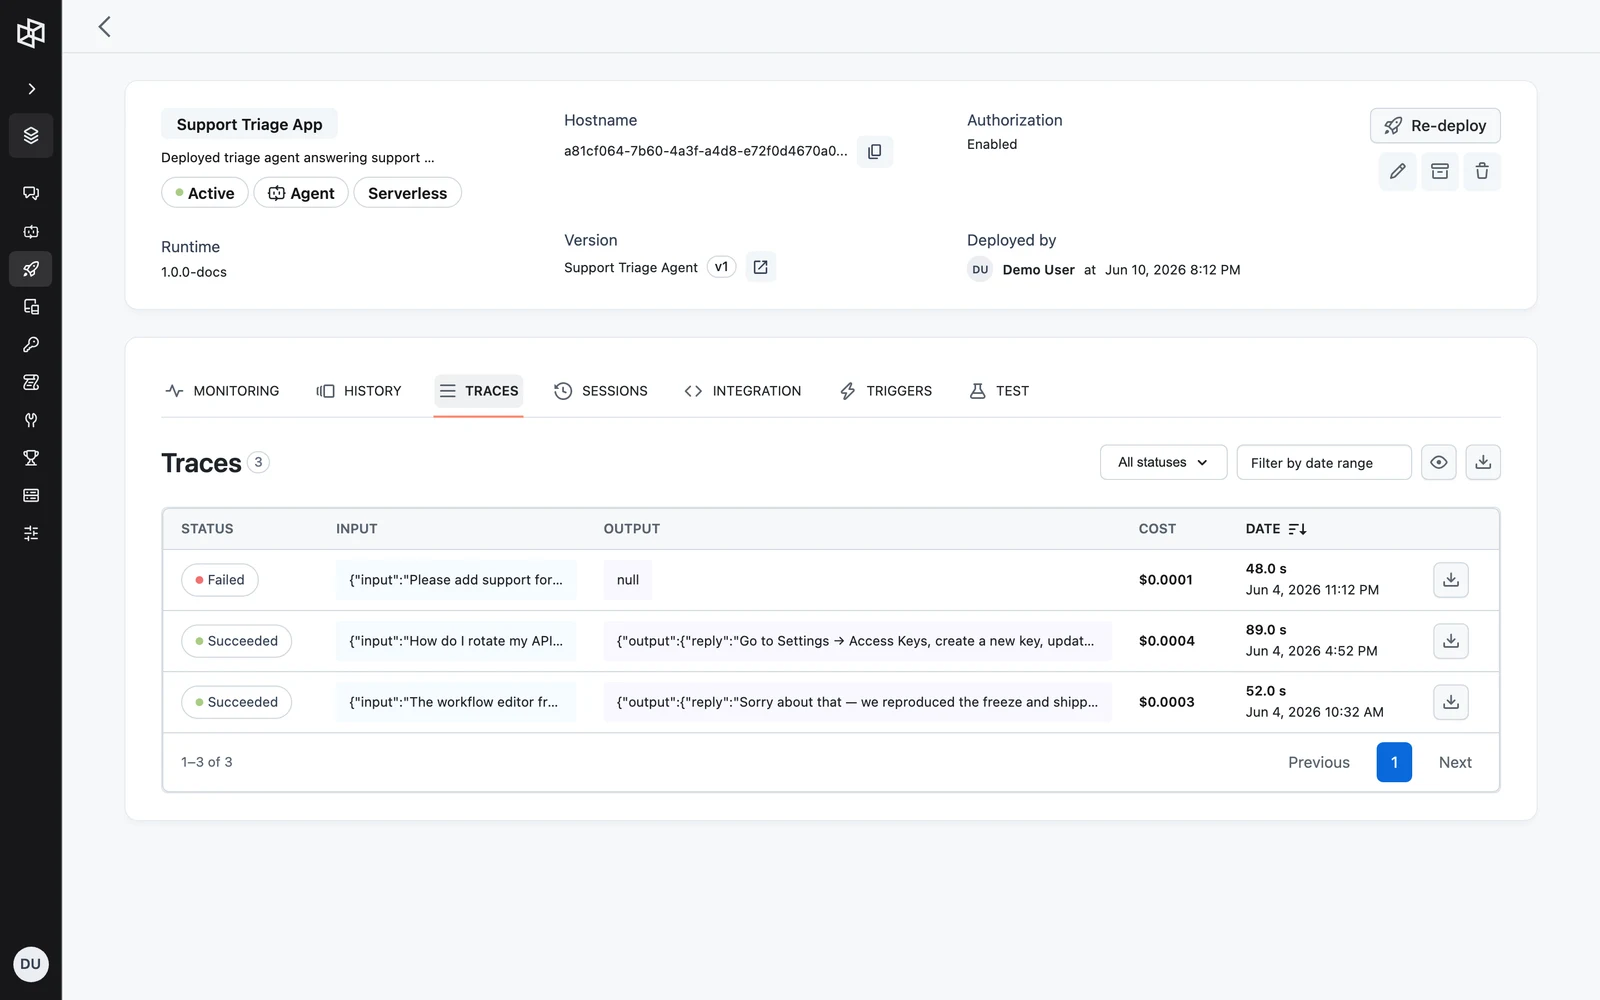
The Traces tab is the run history of your App. Each row is one Run, sorted newest first, with:
- Status — Succeeded, Failed, or Canceled
- Input / Output — the run's input and final output (use the eye icon to expand truncated values)
- Cost — total token cost in USD for the run
- Date — duration in seconds and start time
- a per-row download button that saves the trace as
<trace-id>.json
Filtering runs
Two filters narrow the list:
- Status filter — All statuses, Succeeded, Failed, or Canceled.
- Date range — filters on the run's start time.
The same filters are available on the list endpoint:
curl "https://api.getdynamiq.ai/v1/apps/$APP_ID/traces?status=failed&started_at:gte=2026-06-01T00:00:00.000Z&started_at:lte=2026-06-10T23:59:59.999Z&sort=-started_at&page=1&page_size=20" \
  -H "Authorization: Bearer $DYNAMIQ_PAT"
GET /v1/apps/{app_id}/traces supports filtering on status and started_at (with :gte / :lte style operators), page pagination, and sorting — the default sort is started_at descending.
Inspecting a trace
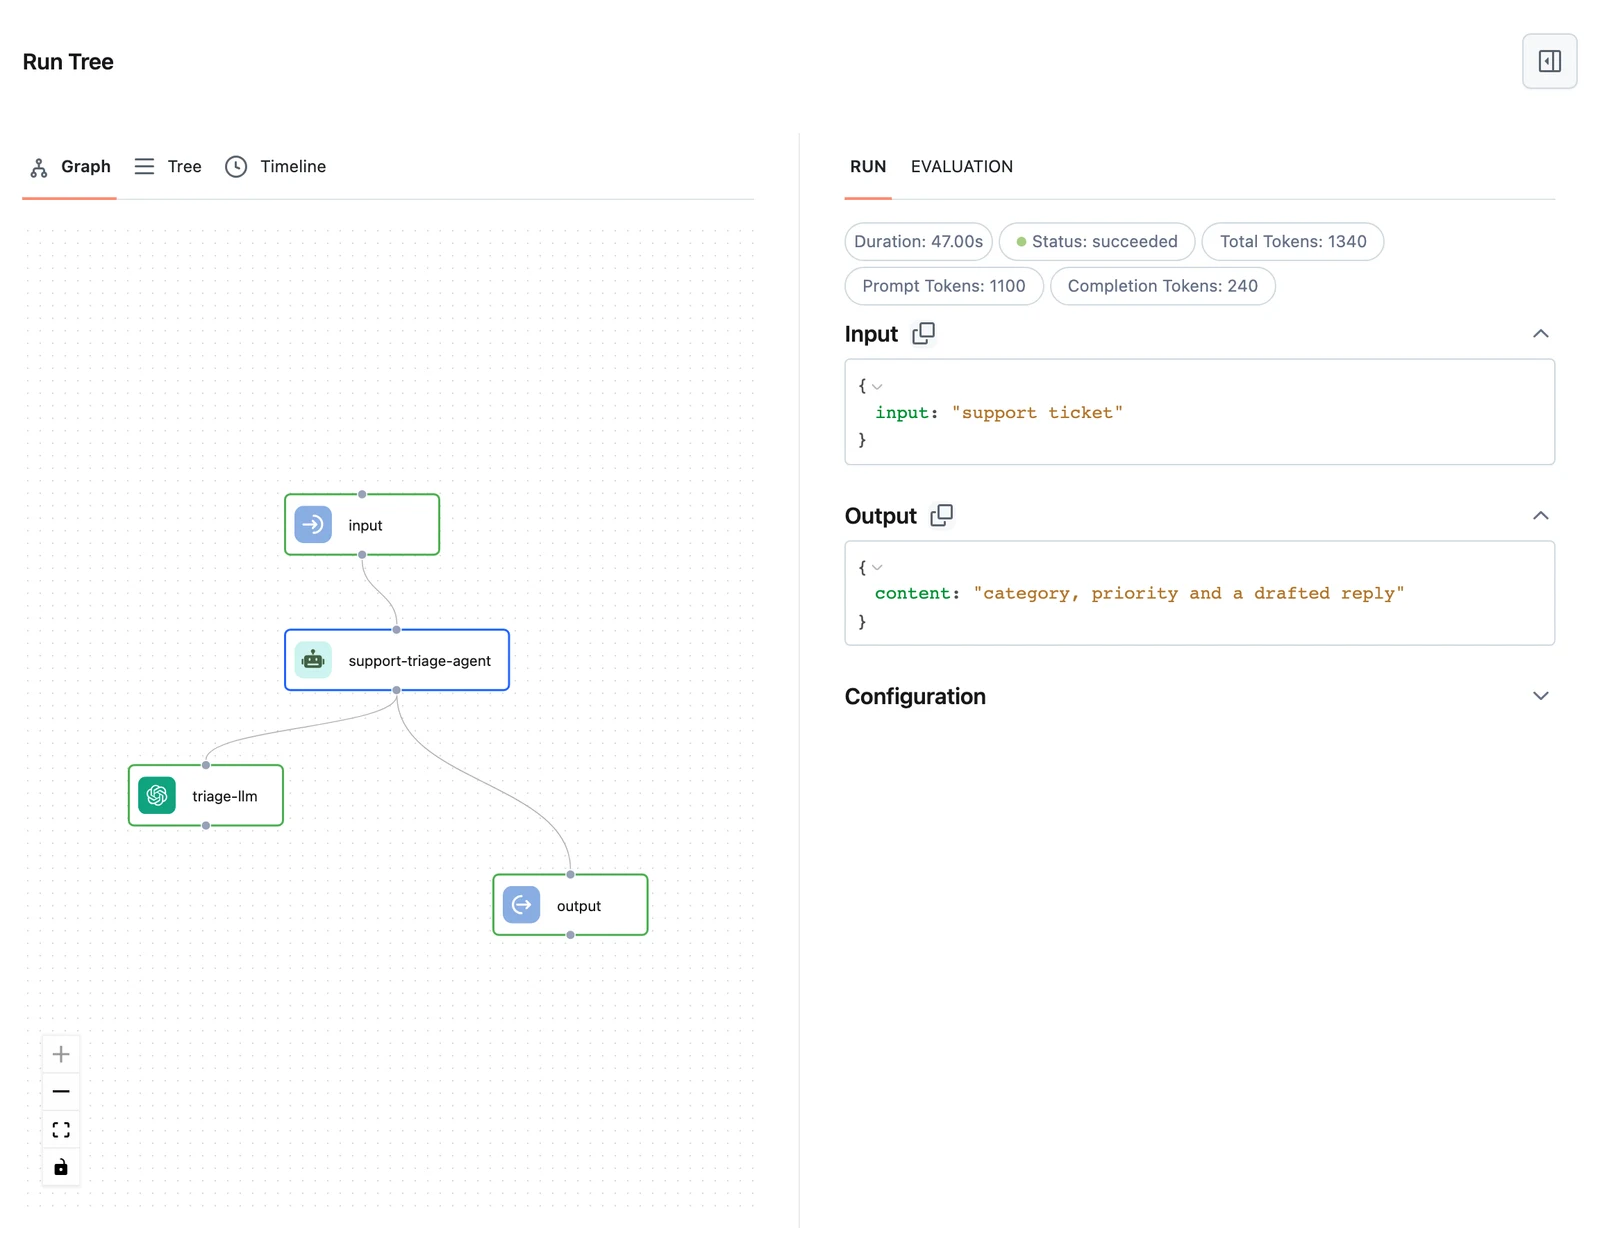
Click a run's status label to open the Run Tree side sheet. The left half shows the execution structure in three views — Graph, Tree, and Timeline — and the right half shows details for the selected node:
- With no node selected: the run's overall input and output, total Duration, start Date, and token usage.
- With a node selected: that node's input and output, its status and timing, the rendered prompt (for LLM nodes), and the node's configuration table.
- Failed runs and failed nodes show an Error banner with the error message.
- The EVALUATION tab lets you add the trace to an evaluation Dataset; it does not display evaluation scores today.
Online evaluations score a sampled share of an App's live traces through the API, but those scores don't surface in this side sheet yet — the EVALUATION tab here only supports adding the trace to a Dataset. Read the scores through GET /v1/app-evaluations/{evaluation_id}/runs, which lists the traces a given online evaluation has scored.
Two related endpoints back this view:
GET /v1/apps/{app_id}/traces/{trace_id}        # the full trace
GET /v1/apps/{app_id}/traces/{trace_id}/runs   # the trace's node runs, newest first
For the full request and response contracts — including cross-project and per-service trace reads — see the Apps and Tracing sections of the API reference.
Downloading traces
Download a single trace with the per-row download button, or use the download button next to the filters to export the traces matching the current filters (when no date range is set, the export covers the time span of the traces currently listed). The bulk export has an Include runs checkbox — when checked, each trace in the file embeds its node-level runs.
The bulk export endpoint streams a JSON attachment named <app_id>-traces.json:
GET /v1/apps/{app_id}/traces/downloadlimitintegerinclude_runsbooleanstarted_at:gtestring (RFC 3339)started_at:ltestring (RFC 3339)curl "https://api.getdynamiq.ai/v1/apps/$APP_ID/traces/download?limit=100&include_runs=true&started_at:gte=2026-06-01T00:00:00Z" \
-H "Authorization: Bearer $DYNAMIQ_PAT" \
-o traces.jsonimport os
import requests
resp = requests.get(
f"https://api.getdynamiq.ai/v1/apps/{os.environ['APP_ID']}/traces/download",
headers={"Authorization": f"Bearer {os.environ['DYNAMIQ_PAT']}"},
params={"limit": 100, "include_runs": "true"},
stream=True,
)
resp.raise_for_status()
with open("traces.json", "wb") as f:
for chunk in resp.iter_content(chunk_size=8192):
f.write(chunk)import { writeFile } from 'node:fs/promises';
const params = new URLSearchParams({ limit: '100', include_runs: 'true' });
const res = await fetch(
`https://api.getdynamiq.ai/v1/apps/${process.env.APP_ID}/traces/download?${params}`,
{ headers: { Authorization: `Bearer ${process.env.DYNAMIQ_PAT}` } },
);
await writeFile('traces.json', Buffer.from(await res.arrayBuffer()));The export is generated server-side with a 3-minute time budget. For very large windows, narrow the date filters or lower limit and paginate by time.
Next steps
Deployment History & Rollback
See past Deployments of this App and roll back to an earlier version.
The Runs API
Work with individual Runs programmatically.
API Keys & Tokens
Create the Personal Access Token used by the management API calls above.
Tracing to Dynamiq
Send traces from SDK workflows running in your own infrastructure into this same view.
Runtime Connection Overrides
How a deployed App resolves node Connections at run time — server-side credential resolution, and per-user substitution through connection requirements.
Deployment History & Rollback
Audit every deployment of an App on the History tab and roll back by redeploying an earlier workflow version.