Testing & Debugging
Run a workflow straight from the editor — the Test panel's Request and Chat tabs, per-node trace inspection, dry runs, and the iterate loop.
You never need to deploy to find out whether a workflow works. The Test button runs the current canvas directly — unsaved changes included — and returns a full execution trace you can inspect node by node: resolved inputs, outputs, rendered prompts, errors, and timing. This page covers the panel, the trace, and the debugging loop.
Open the Test panel
Click Test in the editor header. The editor validates the canvas first — nodes with configuration errors are outlined in red and the panel shows "Your workflow has errors. You need to fix them before saving." until they're fixed.
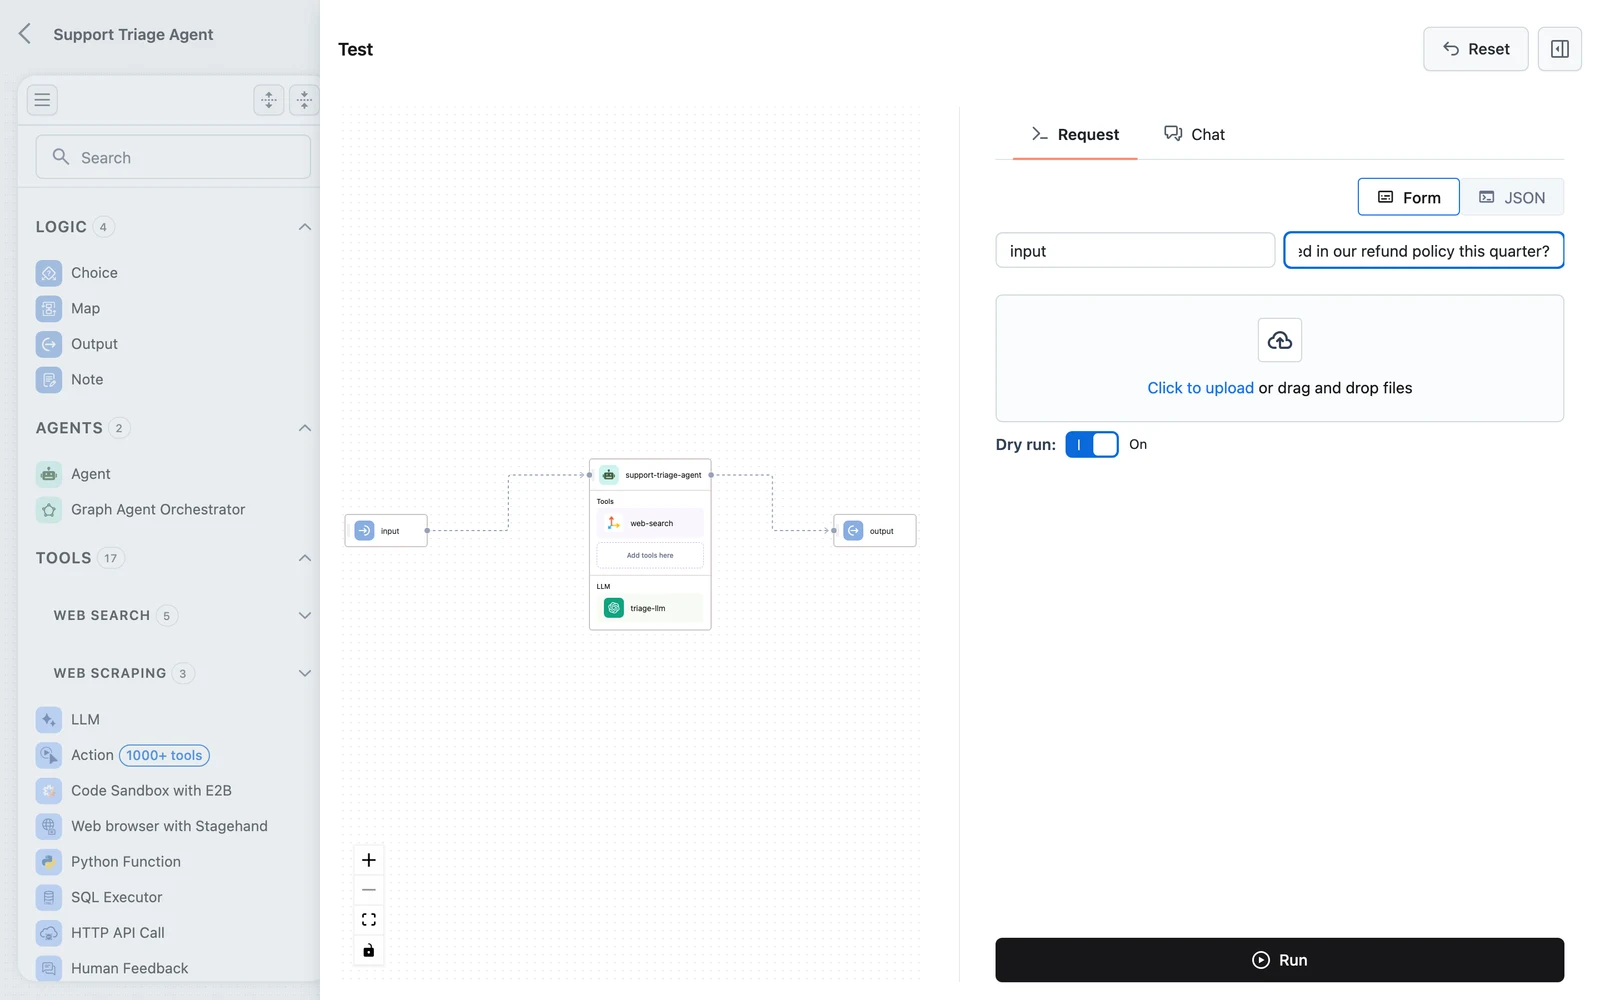
The panel fills the screen: your workflow graph on the left, and a tabbed pane on the right with two tabs — Request and Chat. A Reset button in the header clears the form, attached files, and chat history.
Test is disabled when the workflow uses end-user requirements: "Testing is not available when workflow nodes use requirements. Deploy the workflow to test with requirements." Requirements are fulfilled per end user, so they only exist on a deployed App.
The Request tab
The form is generated from your Input node's fields — one control per field, exactly what a caller would send. Below the fields:
- File upload — attach files for workflows whose Input node takes them.
- Dry run toggle — on by default. A dry run executes the workflow without saving data to the database; turn it off when you want write nodes (vector store writers, memory) to actually persist.
- Run — executes the workflow and streams the run into the trace view.
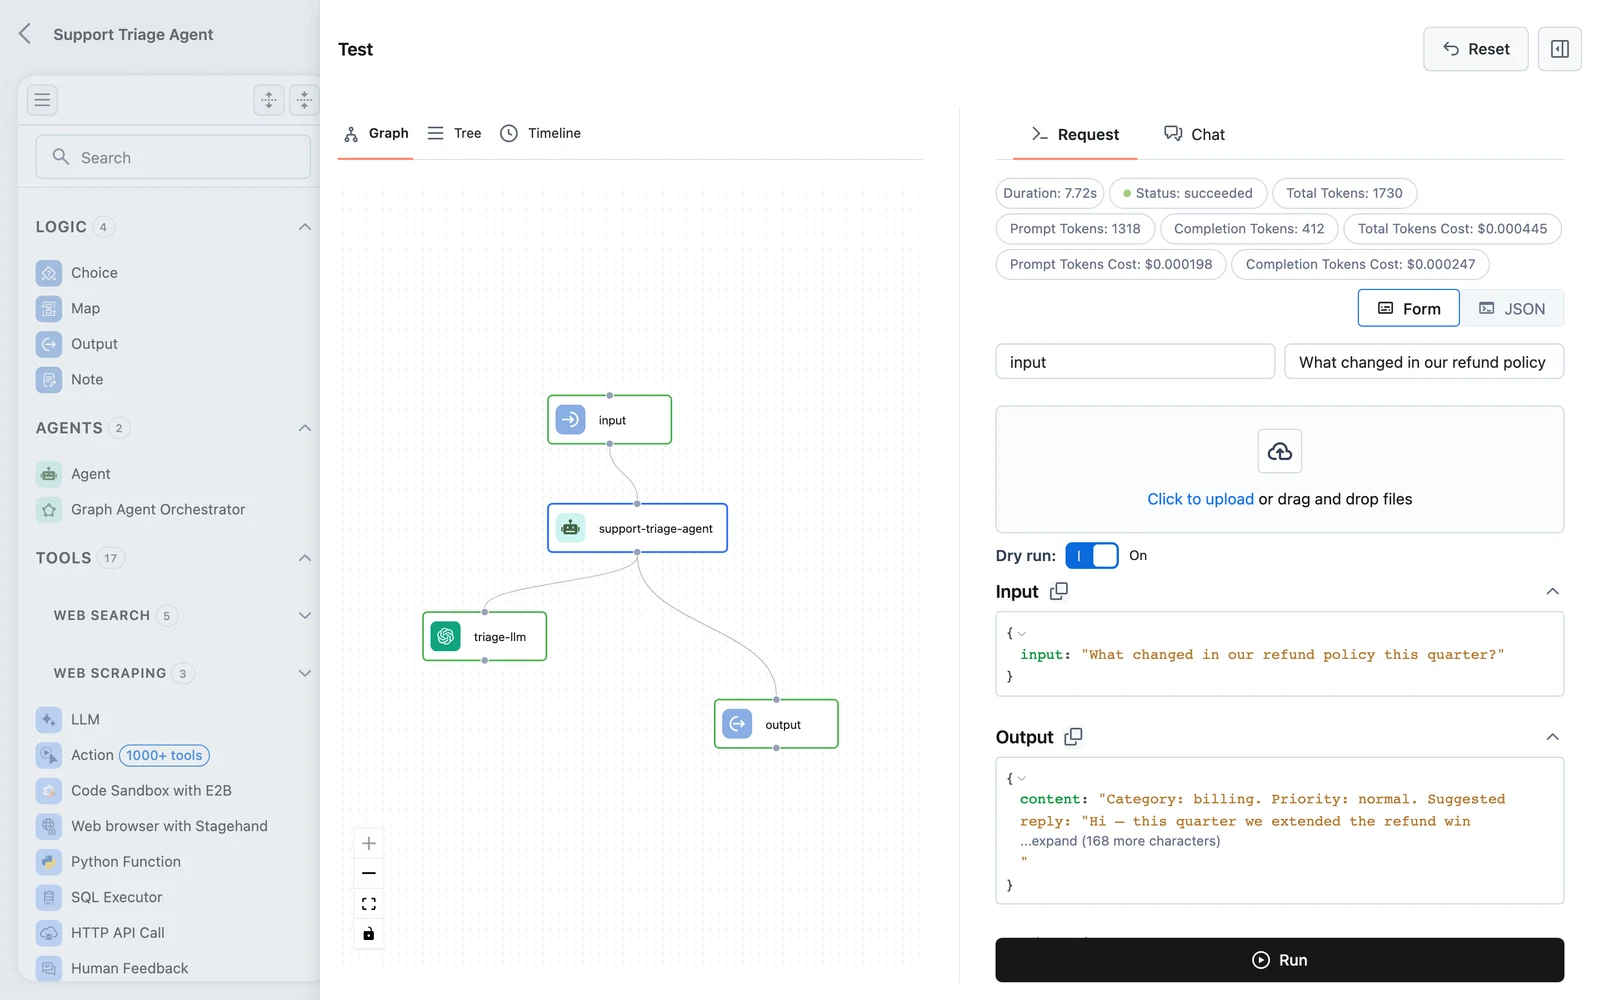
When the run finishes, a Duration label shows the end-to-end time.
Inspect the trace
After a run, the left side switches from the plain canvas to the execution trace: every node that ran, with its status. Click any node to inspect it on the right:
- Status and timing — whether the node succeeded, failed, or was skipped, and how long it took.
- Error banner — for failed nodes, the exact error message.
- Input / Output — the node's resolved input (after selectors were applied) and its produced output. This is where mapping bugs become obvious: a
nullwhere you expected text means a selector matched nothing. - Prompt — for LLM and Agent nodes, the final rendered prompt after Jinja templating.
- Configuration — the configuration values the node ran with.
Reading order for a broken run: find the first failed node, read its error, then check its input — most failures are caused by what arrived, not by the node itself. Walk one node upstream and check its output to see which side of the mapping is wrong.
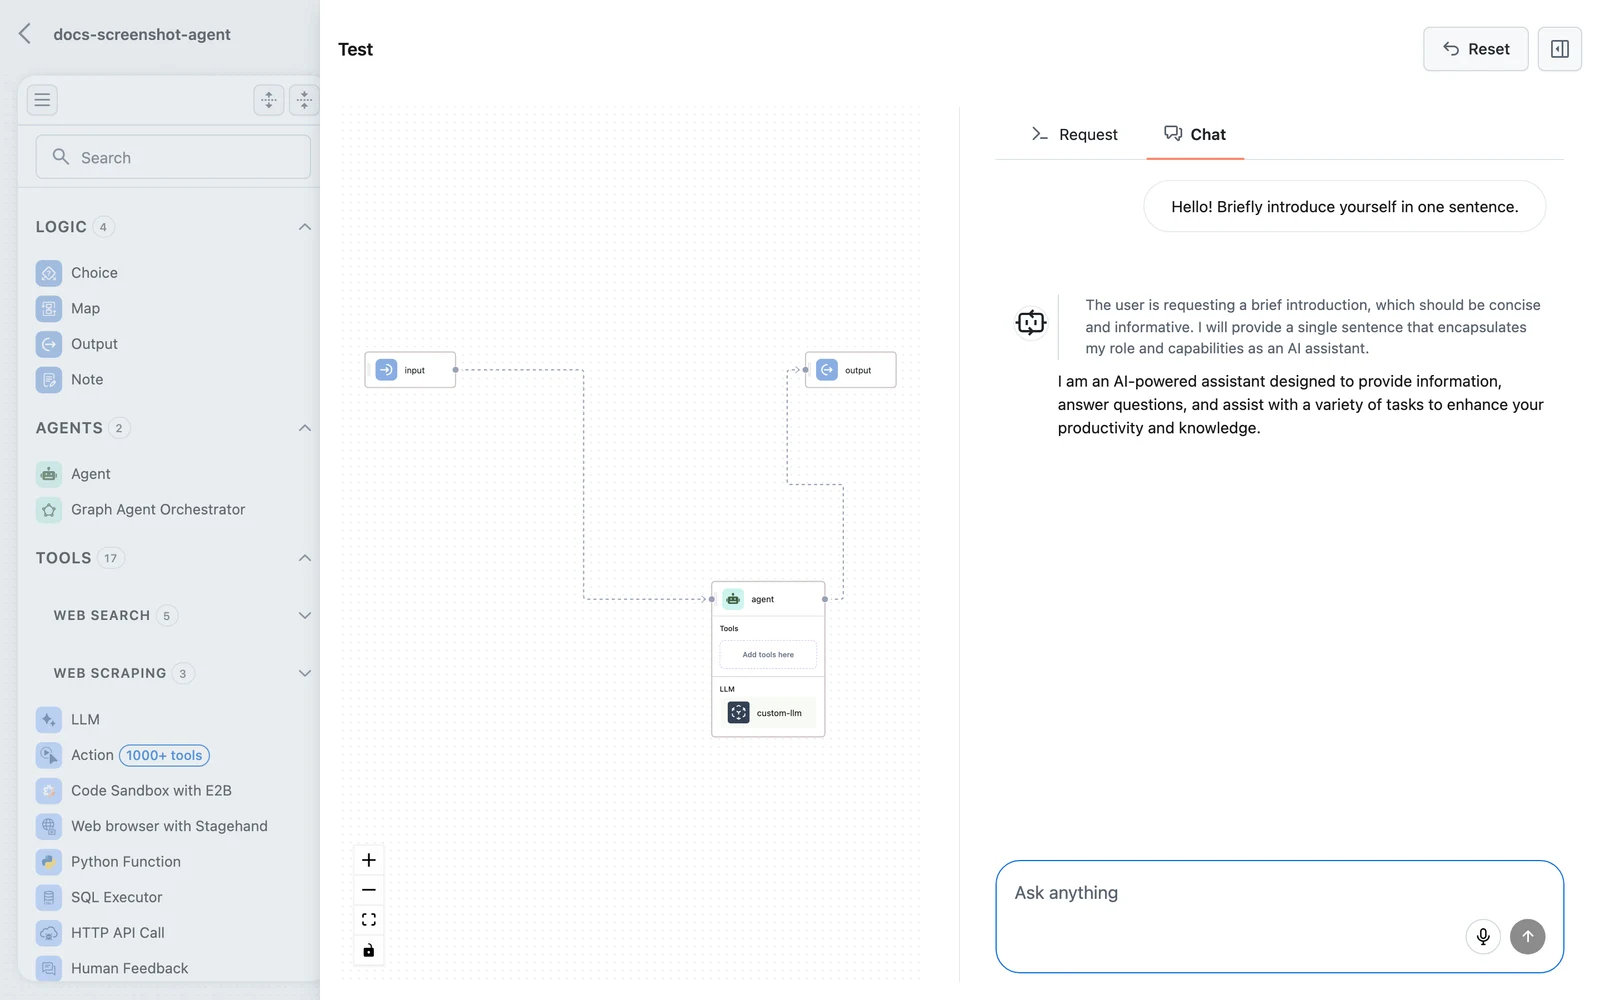
The Chat tab
For conversational workflows, switch to Chat and talk to the workflow turn by turn instead of composing request payloads. The chat view exercises the same graph with the same trace behind it — use it to feel out agent behavior, then return to Request when you need to inspect a specific exchange.
The iterate loop
The panel stays open while you debug, but edits happen on the canvas:
- Run on the Request tab.
- Find the first failing or surprising node in the trace; read error → input → upstream output.
- Close the panel, fix the node (mapping, prompt, configuration), and Test again. Every run uses the canvas as-is — no save required between iterations.
- When the run is right, Save to create a version. See Versions and releases.
You can also test previous versions: open one from the version history (read-only preview) and click Test there — useful to confirm whether a regression came from your latest edits.
Test via the API
The same capability is exposed on the management API as a multipart request (authenticate with a Personal Access Token). The editor uses exactly this endpoint:
curl -X POST "https://api.getdynamiq.ai/v1/workflows/test" \
  -H "Authorization: Bearer $DYNAMIQ_PERSONAL_ACCESS_TOKEN" \
  -F 'flow={"id":"<uuid>","nodes":[...your flow JSON...]}' \
  -F 'input={"input":"What can you do?"}' \
-F 'dry_run=true'| Form field | Type | Description |
|---|---|---|
flow | JSON string, required | The flow definition — id plus the nodes array, as saved by the editor. |
input | JSON string | The workflow input, matching the Input node's fields. |
files | file parts | Attachments for file inputs. Repeat the part per file. |
dry_run | boolean | Execute without persisting data. |
stream | boolean | Stream execution events back instead of a single response. |
last_node_output | boolean | Return only the final node's output. |
error_on_node_failure | boolean | Treat any node failure as a request error. |
The response includes the run's tracing data — the same structure the trace view renders.
After deployment
Once a workflow is deployed as an App, every production run is recorded with the same per-node trace — see Monitoring, history and traces. The skills transfer directly: a production trace reads exactly like a test trace.
Next steps
Error Handling
What happens when a node fails — Raise vs. Return semantics, retries with backoff, timeouts, and fallback paths that keep the run alive.
Versions & Releases
The full workflow lifecycle — drafts, what every Save creates, version history and previews, Save as new, archiving, export, and what Apps pin to.