Financial Services: Transaction Review
A transaction-review and client-reporting agent with per-analyst database credentials, an approval gate before anything leaves the firm, and a full audit trail.
A mid-sized asset manager — call it Meridian Capital — wants one agent to do what three analysts do every morning: query the trade ledger, reconcile flagged transactions against the firm's reporting policies, draft the client report, and route it for sign-off. The hard part isn't the agent. It's the controls: every analyst must touch only the rows their database role allows, nothing may leave the firm without human approval, and compliance must be able to reconstruct any run after the fact. This page walks through that build on Dynamiq, with the permission model as the centerpiece.
Scenario and outcomes
- Input — a review request ("reconcile yesterday's flagged trades for the Growth desk") or a recurring schedule.
- Output — a Markdown report file returned as a run artifact, plus an outbound delivery step that only executes after a human approves it.
- Controls — per-analyst database credentials, runtime scoping the model can't see, role-separated builders and operators, and a downloadable trace for every run.
Architecture
The workflow is a single Agent node with tools, wrapped in controls at both ends. A Schedule trigger or an analyst's API call starts the run; the Agent node plans the review, queries the analytics database through a SQL Executor tool, and grounds its policy reasoning in a Knowledge Base of the firm's reporting and disclosure policies. The agent writes the finished report into its file store, so it comes back as a downloadable artifact. The one node that touches the outside world — the delivery step — carries an execution approval gate, so the run pauses until a person signs off.
| Component | Role |
|---|---|
| Schedule trigger | Fires the recurring morning run on a cron expression in the firm's timezone |
| Agent node | Plans the review, queries data, reconciles against policy, drafts the report |
| SQL Executor tool | Read queries against the analytics PostgreSQL, reached over an SSH tunnel |
| Knowledge Base Retriever tool | Retrieves reporting-policy passages the agent cites in the report |
| Human Feedback tool | Lets the agent ask the operator clarifying questions mid-run |
| HTTP API Call tool + execution approval | Delivers the report — only after a reviewer approves the exact payload |
| File store | The agent writes report.md; it returns with the run as an artifact |
Two invocation paths use this workflow, and they resolve credentials differently — that distinction is the heart of the permission story below. A node's Connection field holds either a concrete connection or a requirement, never both, so the two paths are served by two Apps deployed from two saved versions of the same workflow, differing only in that one field:
- The scheduled App is deployed from the version where the SQL Executor uses a shared, read-only service-account Connection selected at build time. Scheduled runs execute without an end-user context, so this is the right fit.
- The analyst-facing App is deployed from the version where the SQL Executor's connection is flagged as an end-user requirement. Analyst runs arrive through the Runs API with a
user_id, and the platform resolves the connection to that analyst's own credentials.
Build walkthrough
Create the database connection
Under Connections, create a PostgreSQL connection to the analytics database. The connection type accepts an optional ssh_tunnel block (bastion host, user, private key), so a database that is only reachable through a jump host needs no inbound firewall change — see SSH Tunnels. Point it at a read-only database role.
Build the policy Knowledge Base
Create a Knowledge Base and upload the reporting-policy documents — disclosure rules, materiality thresholds, client-communication templates. This is what keeps the report grounded in firm policy rather than model memory.
Configure the agent and its tools
Add an Agent node, then attach the tools: the SQL Executor with the analytics connection, the Knowledge Base via Add knowledge (which adds a Knowledge Base Retriever), and the Human Feedback tool so the agent can ask the operator when a transaction is ambiguous. Enable the file store in Advanced configuration so the drafted report returns as an artifact.
Gate the outbound step
Add the delivery tool (an HTTP API Call to your report-distribution service), expand its Human in the loop accordion, and check Enable execution approval. Put the draft into the approval message template so the reviewer sees the exact payload about to ship. Full mechanics in Human in the Loop.
Test, then save the shared-connection version
With the SQL Executor still pointing at the shared read-only connection, use the workflow Test panel to run a clean review end to end, then Save a version — this is the version the scheduled App deploys. See Testing and debugging workflows. Exercise the approval gate against the deployed App later: reject the approval with feedback over the Runs API and confirm the agent revises instead of delivering (Human in the Loop).
Flag the database connection as a requirement
For the analyst-facing variant, open the SQL Executor's Connection field, switch to the Requirements tab, and create a requirement of connection type PostgreSQL (form title: Analytics Database Credentials). The requirement replaces the concrete connection on the node — which is why the two invocation paths deploy as two Apps — and the editor's Test panel is disabled while a node uses a requirement, so save this as a second version and test it through the deployed App. Each analyst now connects their own database login before the analyst-facing App will run for them — the walkthrough is in End-User Connection Requirements.
Permissions and compliance spotlight
This is the section to read if you're evaluating Dynamiq for a regulated data path. The platform's permission model is: organization roles (Owner, Admin, Member), project membership on Private projects, scoped Access Keys, per-end-user connection requirements, guardrail nodes, and trace auditability. No more is claimed here than the platform enforces.
Each analyst queries with their own credentials
The single most important control in this design is that Dynamiq never widens database access. With the SQL Executor's connection flagged as a requirement, the platform resolves the connection per end user at run time: analyst a.rivera runs the analyst-facing App with her own database login, and the database's own grants and row-level security policies decide what her queries can return. Credentials submitted this way are stored as system-managed, end-user-scoped connections — they never appear in the project's Connections list and are used only for that user's runs of that App (End-User Connection Requirements).
Before each run, your backend checks readiness and onboards anyone missing:
# Has analyst a.rivera connected her database credentials?
curl "https://<your-app-hostname>/v1/requirements/status?user_id=a.rivera" \
  -H "Authorization: Bearer $DYNAMIQ_ACCESS_KEY"

# If incomplete: mint a 24h connect token and send her to the hosted setup page
curl -X POST "https://<your-app-hostname>/v1/connect/tokens" \
  -H "Content-Type: application/json" \
  -H "Authorization: Bearer $DYNAMIQ_ACCESS_KEY" \
  -d '{"user_id": "a.rivera"}'
The scheduled morning run has no end user, so it goes through the scheduled App, whose deployed version uses the shared read-only service connection — scope that database role to exactly the aggregate views the report needs.
Runtime scoping the model never sees
Values like a desk identifier or a client-tier filter must come from the caller, not the model — an LLM can hallucinate a tenant id. The agent's tool_params input merges caller-supplied values into a tool's input at execution time, invisible to the model. Use it to pin the Knowledge Base Retriever's metadata filters to the calling analyst's desk on every request:
curl -X POST "https://<your-app-hostname>/v1/runs" \
  -H "Content-Type: application/json" \
  -H "Authorization: Bearer $DYNAMIQ_ACCESS_KEY" \
  -d '{
    "input": {
      "input": "Reconcile yesterday'\''s flagged trades and draft the client report.",
      "tool_params": {
        "by_name": {
          "knowledge-base-retriever": {
            "filters": { "desk": "growth" }
          }
        }
      }
    },
    "user_id": "a.rivera"
  }'
For the SQL data itself, prefer the database-enforced path above: per-user credentials plus database row-level security is a control your auditors already know how to test.
Builders vs. operators: roles and Private projects
Separate the people who can change the workflow from the people who run and approve it:
- Keep the workflow, connections, and Knowledge Base in a Private project. Private projects are accessible only to org Owners/Admins and explicitly added project members — put the builders there (Members & Roles).
- Analysts and approvers never need project access at all: they interact through the deployed App's endpoint and the approval round trip, authenticated by an Access Key your backend holds.
- Org-level management (inviting members, changing roles) requires Owner or Admin; Owner and Admin are currently enforced identically, so treat the distinction as convention.
Project-member roles (admin/editor/viewer) are stored but not yet enforced — any member of a Private project can currently do what any other member can. Use project membership itself, not the viewer role, as your access boundary.
Every run is reconstructable
Each run of the deployed App records a Trace: the run's input and final output, a node-by-node execution tree (including every SQL query the tool executed and every policy passage retrieved), per-run token cost in USD, duration, and status. For attribution, runs created with a user_id are filterable on GET /v1/runs — so "which analyst ran this and what came back" is one query. Approval decisions are part of the run too: a rejected gate shows the feedback text flowing back into the agent's loop.
For periodic compliance archiving, export traces in bulk (up to 1,000 per request, with node-level runs embedded):
curl "https://api.getdynamiq.ai/v1/apps/$APP_ID/traces/download?limit=1000&include_runs=true&started_at:gte=2026-06-01T00:00:00Z" \
  -H "Authorization: Bearer $DYNAMIQ_PAT" \
  -o june-traces.json
Access Key hygiene
The App endpoint is private — Endpoint Authorization on — so every call needs an Access Key. Policy that has worked well for this pattern:
- One project-scoped key per consuming service (the analyst portal, the scheduler integration), never an organization-wide key. Revocation stays surgical.
- Set
expires_aton every key so forgotten credentials age out. - Rotate by create-then-delete: create the replacement key, deploy it, delete the old one. Revocation is immediate — the next request with the old secret fails.
- Keys are stored only as SHA-512 hashes with a short preview; the full secret is shown exactly once at creation (Security).
Deploy and integrate
Deploy both workflow versions as Apps with Endpoint Authorization checked — the shared-connection version for the scheduled App, the requirement version for the analyst-facing App. On the scheduled App, add a Schedule trigger — for example a Recurring schedule, daily at 06:30 in America/New_York — for the morning run.
The approval round trip runs over the Runs API: when the delivery gate is reached, the event stream emits approval_request.created and the run waits. Your portal answers with POST /v1/runs/{run_id}/input — approval_request.confirmed (optionally with edited values for the gate's mutable params) or approval_request.rejected with feedback. If no one answers within the gate's input timeout, the run checkpoints and pauses; it shows up under GET /v1/runs?status=awaiting_input and resumes whenever the reply arrives — minutes or days later. Transport details are in Streaming & Async Jobs.
The finished report is listed by GET /v1/apps/{app_id}/runs/{run_id}/artifacts with short-lived download URLs (List run artifacts).
Evaluate and monitor
- Quality — build an evaluation loop before widening rollout: capture real production traces into a Dataset directly from the trace view, score report drafts with an LLM-judge Metric against your reporting rubric, and compare workflow versions on the same released dataset before promoting one.
- Operations — the App's Monitoring tab charts requests, latency, tokens, and cost per period; the Traces tab is the run-by-run history with status and date filters (Monitoring, History & Traces).
- Rollbacks — every deployment pins a workflow version; if a prompt change degrades report quality, roll back to the prior version.
Next steps
End-User Connection Requirements
The full lifecycle for per-analyst credentials: define, discover, fulfill, run.
Human in the Loop
Approval gates, mutable params, and how paused runs resume.
Agent Tools
tool_params and the rest of the tool catalog.
Members & Roles
The enforced permission model for organizations and Private projects.
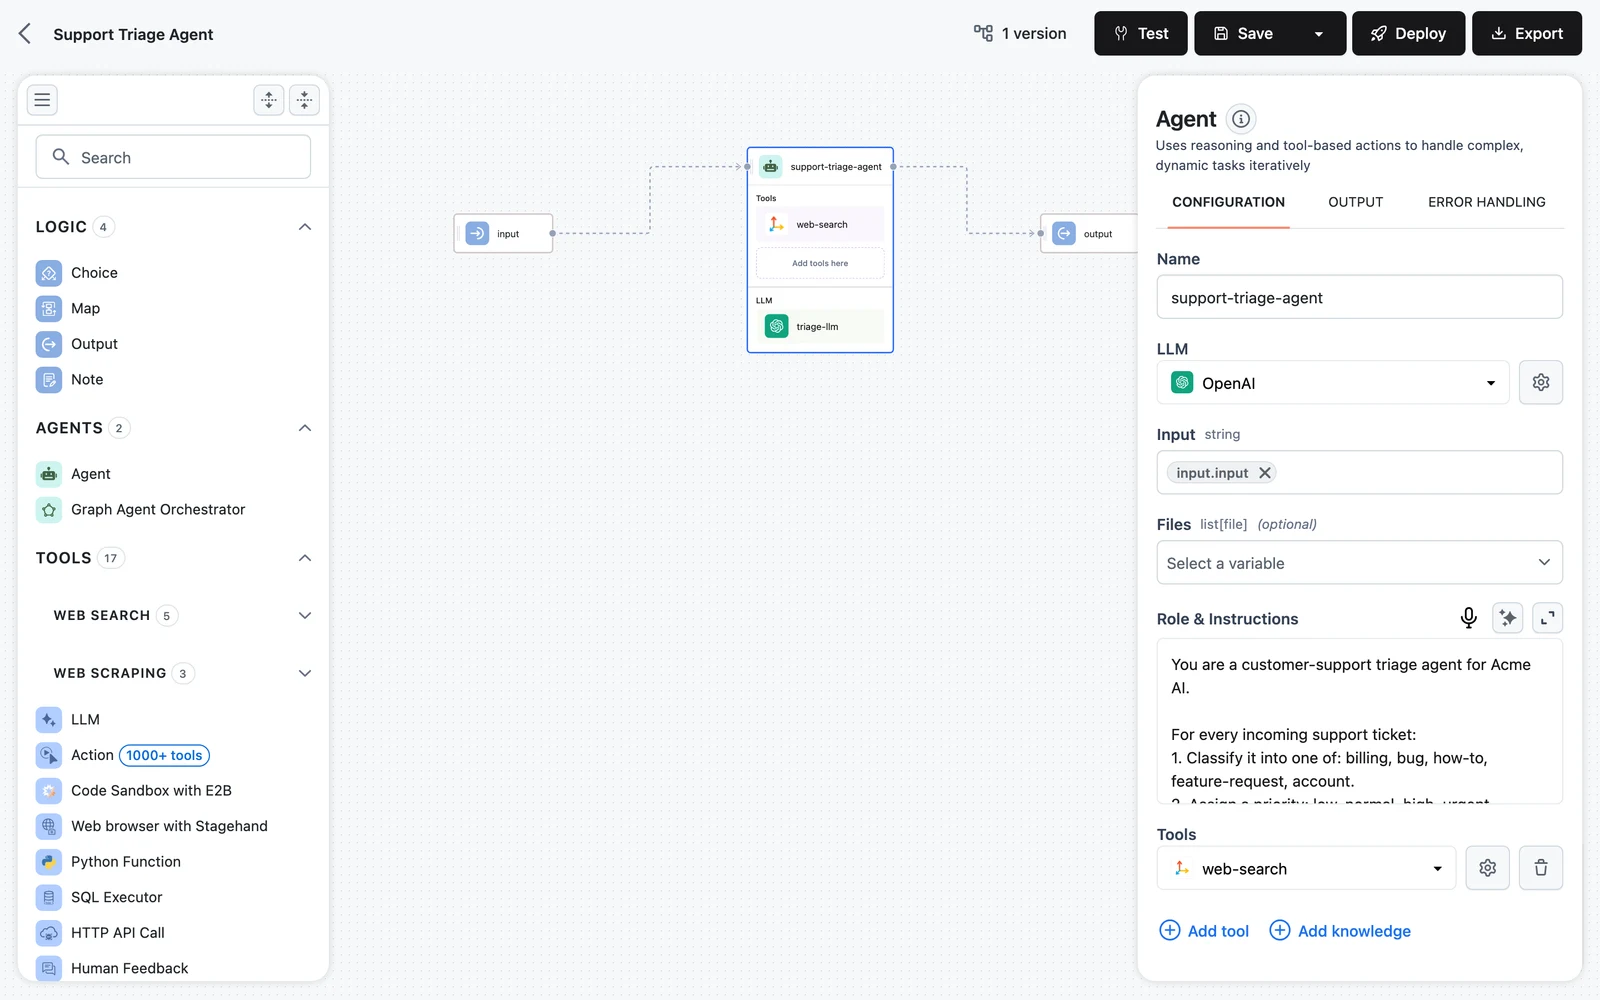
Customer Support: Triage Agent
Build a support triage agent that answers from a product-docs Knowledge Base, holds multi-turn conversations, escalates to humans, and leaves an audit trail.
Healthcare: Patient Document Intake
A patient-document intake pipeline that screens for PII and prompt injection before any LLM sees the text, then extracts schema-conformant clinical data.